


As markets emerged, blinking into the light of day towards the end of the Covid crisis, equities saw a rotation in style leadership. Growth went out, value roared in, then oil and gas went through the roof… and sustainable funds also saw their outperformance (in aggregate, at least) ebb.
Is this simply a style effect—and if so, to what degree? After all, sustainable funds are reputed to have a growth bias. So, if the situation is as simple as ‘ESG equity = growth’, then of course they will lag in a value market. Indeed, they may still lag in a growth market, if that growth comes from a very narrow number of stocks, as has been the case with the ‘Magnificent Seven’ this year.
It’s therefore useful to compare like with like, in terms of both market capitalisation and style, to see if these effects persist.
We looked at performance over one, three and five years across style and cap classifications in Lipper’s Equity Global classification, comparing ESG and conventional funds. Global equity funds are the natural home of sustainable investments. It is the most popular sustainable market by total net assets (more than £77bn ascribed to the Lipper Global Classification in the UK). They have seen the largest inflows of any classification over 12 months to the end of September, beaten only by a surge in US equity flows for the third quarter of 2023.
Holdings-based style analysis categorises fund equity allocations down into geography, style, and market cap, based on the characteristics of the individual equities in their portfolios. It provides a transparent quantitative model that can be applied consistently across global markets, providing dynamic peer groupings for performance, risk, and overall comparisons. While the buckets this analysis creates will still vary within themselves regarding these criteria—some growth funds will be growthier than others in the same category—it provides a useful, discrete grouping.
For funds in the global classification for which we have holdings-based data, £392bn is in funds that have some sort of ESG commitment, while £272bn is in “conventional” funds. We have excluded holdings-based classifications where there are insufficient numbers of funds to make a meaningful comparison, along with smaller geographical and cap-size Holdings-based classifications (HBCs) within the Equity Global classification (unsurprisingly, there is a fair amount of overlap here). This leaves Global and US geographical classifications, and the latter is also to be expected, given the size of US market. I’ve excluded these from the like-for-like comparison in the table, which is ordered by total net assets of Equity Global ESG HBCs, where we have an equivalent conventional HBC.
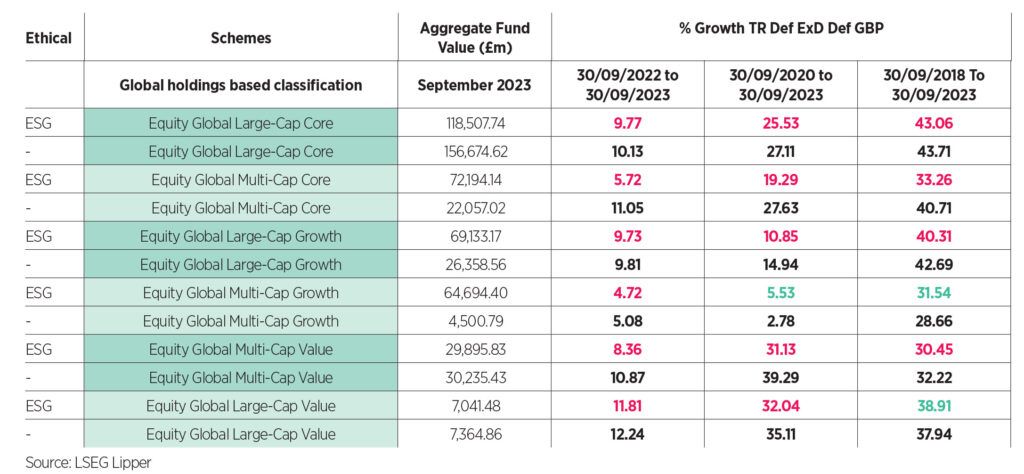
This leaves us with six HBCs to compare ESG with conventional performance, across Large- and Multi-Cap, Value, Core, and Growth.
Bundling together ESG and conventional funds, distinct patterns arise: over five years, cap effect is the most noticeable driver, with the top three all being large-cap and the bottom three multi. Over three years, style effects come through like oak on an Aussie chardonnay: respectively, value, core, then growth. And over 12 months, it’s clearly large-cap driving returns again, but with value beating growth in both large- and multi-cap—a surprising result, perhaps, given the dominance of the ‘Magnificent Seven’ this year.
Oil and gas effect
Things get interesting when we slice these six classifications into ESG versus conventional. Over one year, all ESG HBC classifications underperform their conventional peers. Over three years, only one sustainable classification outperforms (Multi-Cap Growth); over five, just two (Multi-Cap Growth and Large-Cap Value).
Since the “vaccine bounce” of autumn 2020, the commanding lead that ESG global equity funds enjoyed has been nibbled away at—something that has accelerated with the fillip given to energy stocks. There is certainly an oil and gas sector effect at work here.
All the HBCs, whether ESG or conventional, have oil and gas exposure, although, as you’d expect, it’s heavier in conventional funds. But it’s more than ‘brown‘ funds benefitting from exposure to oil and gas. At the other end of the energy spectrum, renewables have been hammered over the past year: while the MSCI ACWI is up about 10% over 12 months to the end of September, the S&P Global Clean Energy Index, comprising of the largest companies in solar, wind and other renewables-related businesses, is down almost 30%. Constituents span sectors from utilities and industrials to IT.
This market has been hit by rising costs, coupled with a limited ability to pass them on. Many renewable energy businesses are locked into long-term contracts on fixed prices, plus are carrying significant debt. Both elements have proven to be toxic in this rising rate environment, despite the increased funding for renewable projects coming from Europe and the US.
It’s likely no coincidence that the ESG HBC that most lags its conventional sibling over a year—Equity Global Multi-Cap Core, at 5.72% to 11.05%—looks significantly exposed to this area of the market. Conversely, ESG HBCs where there is less of a gap over 12 months, such as Equity Global Multi-Cap Value, seem to have little renewables exposure.
Overall, then, if the “higher for longer” rate consensus is correct, it seems likely that funds navigating this section of the market, as defined by sustainable policy, and commensurately style and cap size, will continue to face greater headwinds.