


While carbon emissions remain the primary measure of how climate damaging or climate friendly products and businesses are, the huge question of indirect emissions continues to be puzzling.
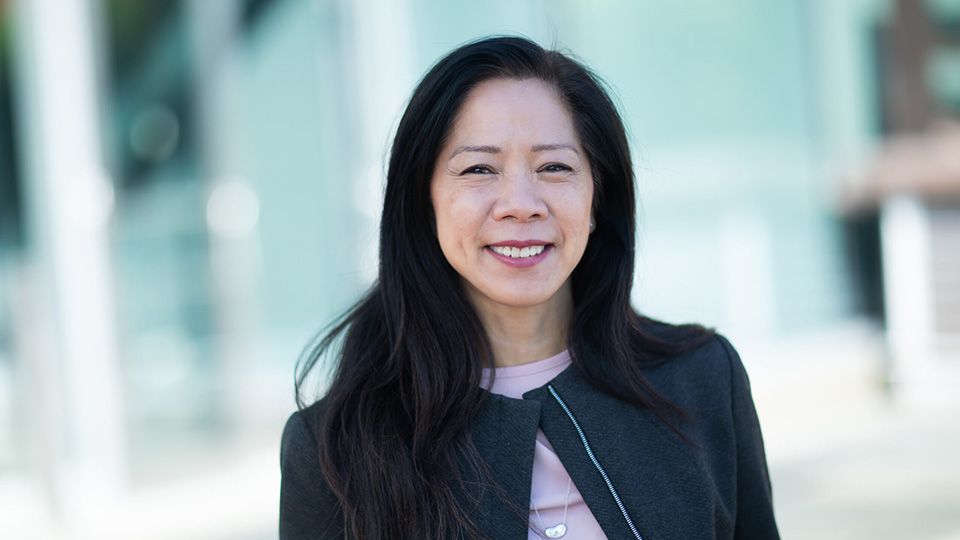
Deborah Ng, head of ESG and sustainability at GMO, explained how the asset manager is taking on the challenge of cracking Scope 3 and how their methodology could be helpful in other fields.
What motivated the search for a more accurate picture on Scope 3 emissions?
We noticed there’s a lot of focus on Scope 1 and 2 emissions. Investors, companies – everyone’s setting targets on these.
We realised about 80% of a company’s emissions exposure is really in their Scope 3 data. So when I’m thinking about a net-zero commitment, and I’m thinking about companies setting zero-targets, they’re missing about 80% of that risk exposure. For us that’s a material thing we need to figure out how to have a better view on – our exposure to carbon transition risk rates.
For example, thinking about carbon taxation, that could change a company’s cost structure dramatically.
What’s wrong with the way companies report Scope 3 emissions?
There’s not a lot of guidance on it. The Greenhouse Gas Protocol gives you 15 categories and tells you you need to figure out what’s most material to you and report on that. Different companies in the same sector inevitably choose different things.
In fact, we did some research and found the vast majority of companies report business travel – for many companies that’s not the most material Scope 3 emissions they have, it’s just the easiest to measure.
We looked at that and said how can we come at it in a better way? If I have companies that are reporting different Scope 3, and I’m trying to build a portfolio or I’m trying to understand how companies are exposed to carbon transition risks, I can’t do that with Scope 3 data the way it’s being recorded now. I can’t tell if the company’s doing better than another company. I can’t tell which companies are going to have higher risk. So we need to be able to compare companies when we’re thinking about putting together a portfolio but also when identifying and engaging with companies.
So what it the GMO approach?
We start from thinking that everyone’s indirect emission is someone’s direct emission. People can reasonably estimate their direct emissions so we said: “If we start with everyone’s direct emissions, then how can we take that closed system and allocate it across different companies?” It all has to add up at the end, right?
You have 41 gigatons of CO2 being emitted globally – we take those 41 gigatons and figure out how we distribute it across all the different companies. We created a methodology that starts with a top-down view – a sector/country view of the universe using an input-output model [which] allocates different GDP growth across different sectors and across countries.
Many existing vendors do use these types of top-down models, but we combine it with a bottom-up assessment. We incorporate reported industry segment revenue data and supply chain relationships from companies.
So you have a top-down model that allocates emissions at the sector level and then within the sector level we have bottom-up information that allows us to propagate those emissions levels. In a very simple way, we’re mapping this gigantic emissions flow diagram. And we start with those direct emissions.
Also, we look at not just Scope 1 emissions from companies but household emissions because that is an area that is often missed.
And what’s the benefit of this approach?
By doing that in a very consistent way, we’re able to identify the companies that are choosing more efficient suppliers and we don’t just go to the first-tier suppliers. Because the model is iterative, it goes to the second-, third-, fourth-tier suppliers, right down to the mine. And even at the mine, let’s say, we actually estimate the emissions from the mining operation buying trucks etc, so it’s very circular in some ways.
It allows us to better distinguish between companies that are actually doing a good job managing their emissions and their supply chain emissions versus those that are not.
Where we don’t have direct supply chain information we do rely on industry averages, but it’s a lot more granular than you’re going to see in other models where they look at, for example, purchase goods and services as a Scope 3 category. It’s just one big lump sum emission set, whereas we break down the purchase products and services from the actual sectors and companies.
How accurate have you found this to be when calculating emissions? What limitations does it have?
When we think about the global supply chain model we found we’re accounting for about 89% of global emissions [so] we know we’re capturing the vast majority of global emissions. Companies can report their supply chains and revenues quite well so generally that information is reported accurately. The margin of error probably comes more when you’re relying on the industry segments. But again, I think it’s a much more accurate, refined and robust tool than existing Scope 3 models that are out there.
Also, it’s many times better than companies’ reported Scope 3 emissions. It’s very difficult to estimate for companies and they’re missing quite a lot of data. They don’t get the information they need from their suppliers so they’re making guesses and it just compounds.
How has the approach changed your investment strategy and engagement?
We think it gives us a better picture of the total emissions risk and we get insights for when we engage with companies – we can identify where their sources of emissions are and can better help them pinpoint areas they need to address first.
I think [with this approach] you’re paying more attention to things like goods, like the industrial and materials sectors which are going to have a lot more of the Scope 3 emissions. It helps in terms of looking at companies that are trying to help others to decarbonise. This, in turn, helps with being able to make clear allocation decisions across all sectors of the economy.
We’ve been working on using it in portfolio construction so it’s more of a systematic approach that really targets 50% lower indirect emissions than the benchmark. Our next step is we are going to start measuring it in our portfolio and then through that develop the engagement programme.
Are you using Scope 3 in decarbonising GMO?
[Indirect emissions] wouldn’t fall under our current Scope 1 and Scope 2 targets for financed emissions. But I think it might be something we would think about as a separate item to report on and to understand – what kind of reductions we could make on that.
Ultimately, anyone with a net zero by 2050 commitment will need to address Scope 3 by 2050.
Right now, we’re focused on the engagement with companies on Scope 1 and Scope 2 and on recording of Scope 3. While we don’t think recorded Scope 3 is very reliable for us, we think it’s important for companies to understand and attempt to measure it themselves. Because what gets measured gets managed, so they can’t be thinking about the supply chain without understanding where those emissions are coming from.
Where else could this way of calculating Scope 3 be useful?
This is my take on it, not necessarily GMO’s here, but I think it would help inform where to focus policy. By understanding the full value chain of emissions, I think policymakers can better understand where the largest sources of emissions are coming from. Many of the raw inputs that go into our purchase goods and services are things like agriculture so they’re probably not in the public market domain. [It could help] inform policy see where they need to focus and help them analyse what’s the impact of a broad-base carbon tax, which is probably what you need to get everyone aligned – rather than focusing on one or two sectors alone because there’s a lot of potential for carbon leakage.
It maps the emission flows between countries as well. So if you’re importing goods from a high-emissions country that still has a lot of coal-fired power plants you will actually see higher flows coming in from those areas. It can help with this idea of how to flow emissions through a system in a fair way. And then how do you think about the border taxes and integrated carbon policy.