


ESG attributes can vary between geographies and for investors looking to align their investments to their values, it’s important to consider what drives these differences. To demystify this area of investing, its important for investors to look at how ESG metrics differ with region; from market to market, driven by different sectors, industries and economic factors.
To do this, Nutmeg’s research selects an index in each region that is most commonly followed: the UK by the FTSE 100, the US by the S&P 500 and the rest by the corresponding large and mid-cap MSCI index. The scoring data is obtained from MSCI, an acknowledged leader in ESG research and analytics.
Then, Nutmeg scores each category from 0-10, where a higher score signifies better adherence to the corresponding principle from the underlying companies. We also include the MSCI All Country World Index as a representation of how global equites score in aggregate (though it’s worth bearing in mind that the MSCI ACWI score will be influenced by its largest geographic exposure, the US at more than 50%).
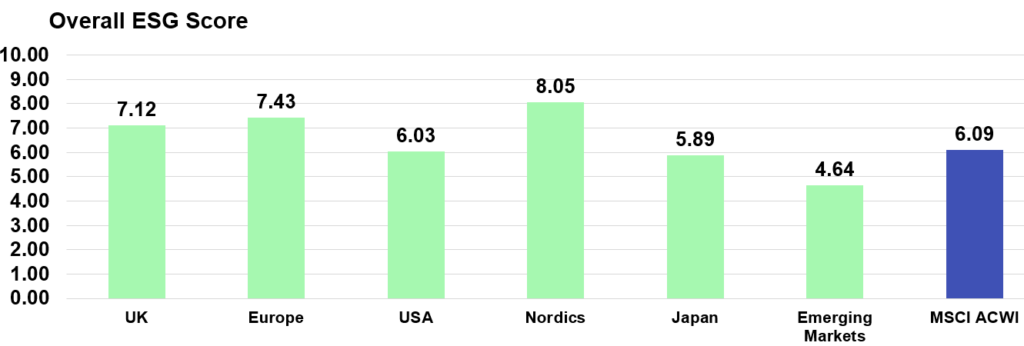
Overall, the Nordic and European equity markets lead the world with the UK coming in third. MSCI ACWI is pushed lower due to its high allocation to the US, with Japan, the US and emerging markets coming in last.
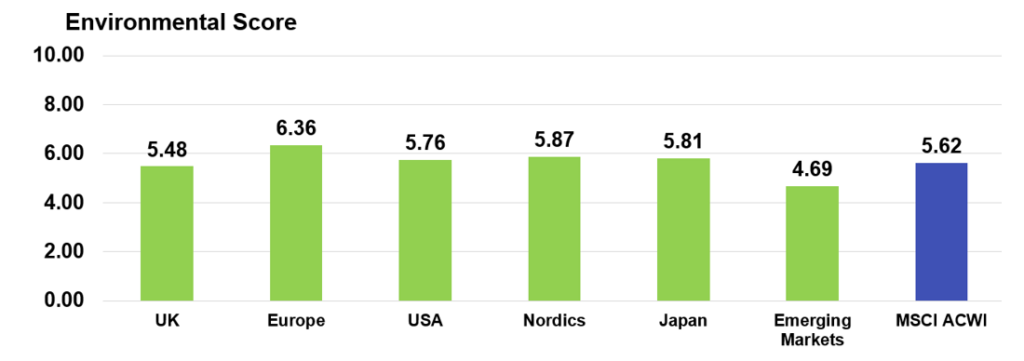
Europe and the Nordic countries also come out on top for environmental scores – with 6.36 and 5.87 respectively. A higher score means that companies in this group are better positioned at managing key environmental risks and opportunities such as climate change, pollution and the use of natural resources.
These scores can be driven by sectoral differences in the regions’ respective major equity indices. The UK and emerging markets have higher exposures to energy, industrials and resource extraction companies as a share of their respective indices and so have a lower environmental score.
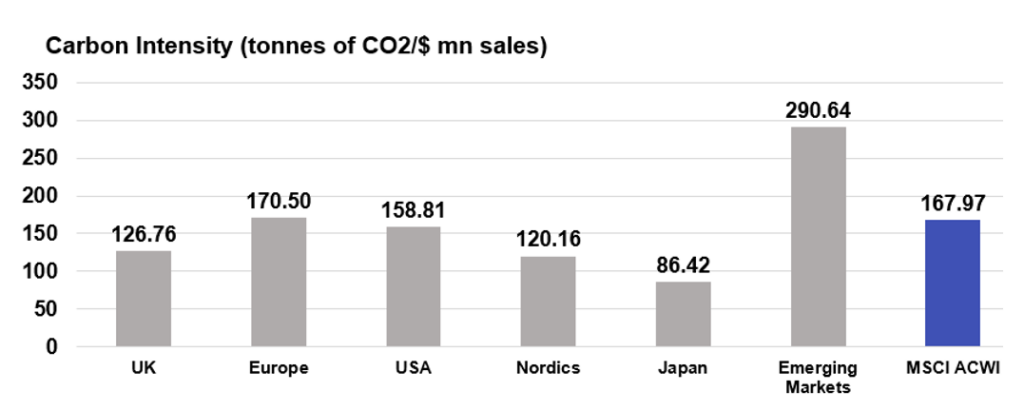
Emerging markets demonstrate a higher carbon intensity score relative to other equity markets, at 290.64. A higher carbon intensity signifies lower carbon efficiency, or more CO2 being produced per million dollars of sales. Japanese equities score well on environmental issues and exhibit the lowest carbon intensity globally, despite industrials (20%) accounting for the largest sector exposure on a market capitalisation-weighted basis.
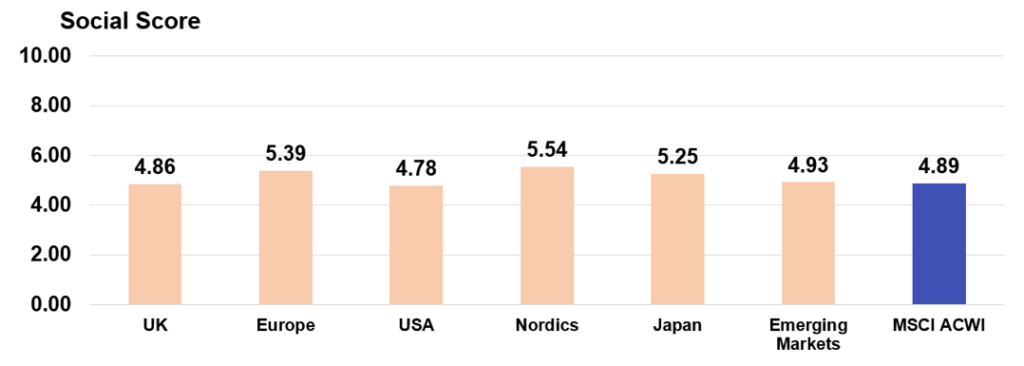
Looking at the social score across geographies, most regions hover between a score of 4 and 5, with Europe and Nordic equities again leading with 5.39 and 5.54 respectively. Interestingly, emerging markets (4.93) score slightly better than the US (4.78) in their exposure to holdings’ ability to better manage exposures to key social risks and opportunities.
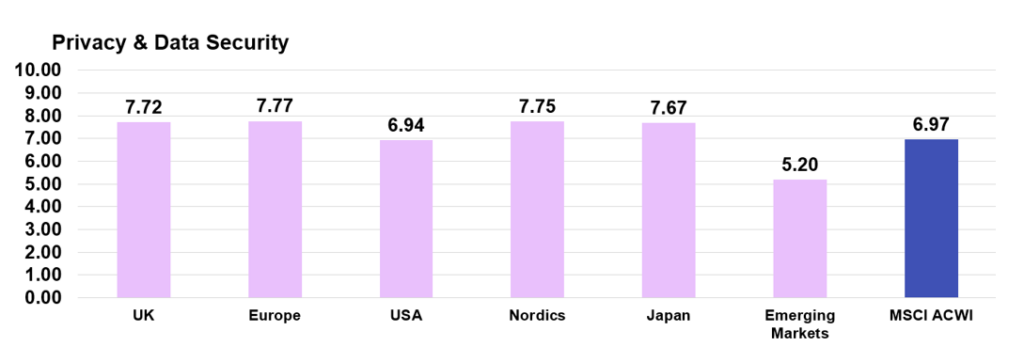
In privacy and data security however, emerging market equities score lower, at 5.2 compared with 6.9 for the US and MSCI ACWI and above 7 elsewhere. Information technology and communication services companies account for close to 30% of broad emerging markets equity exposure (MSCI Emerging Markets Index), where these companies are in a transition process of adopting privacy policies and internal data security controls that are on par with global leaders in developed nations.
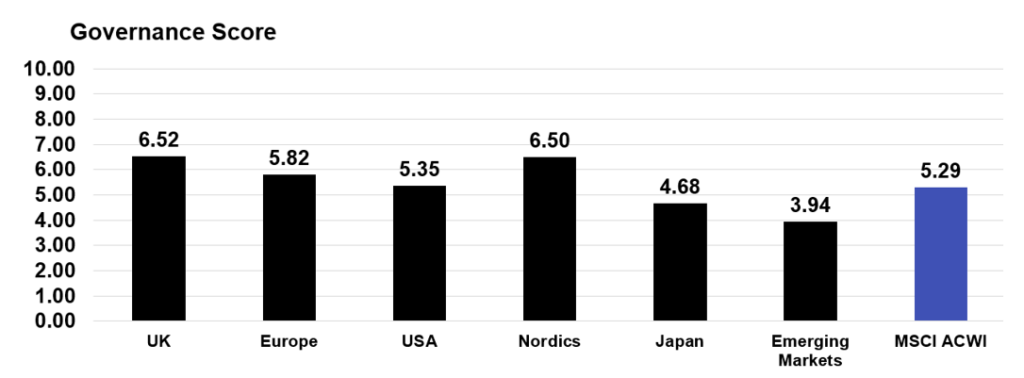
On governance, Nordic and UK companies lead, with a higher exposure to companies well-positioned to manage exposure to key governance risks and opportunities. If we look deeper into intra-issue scores, further disparities appear, particularly in gender diversity.
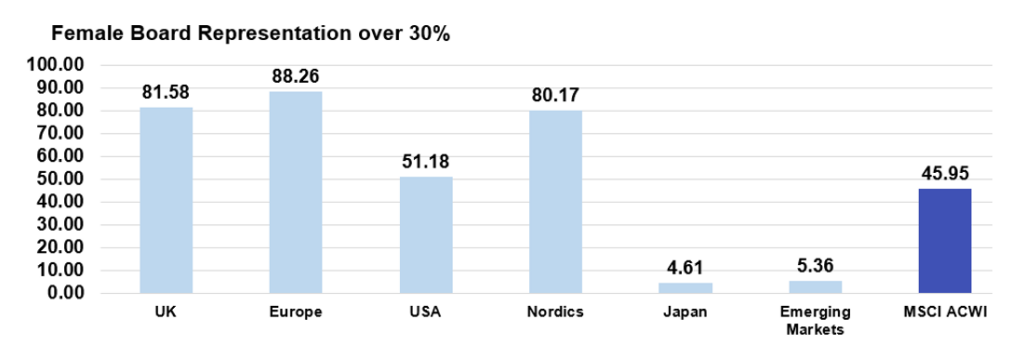
When it comes to board gender diversity, Europe leads the world, with more than 80% of companies exhibiting female board representation at more than 30% across the UK, broad parts of Europe and the Nordic countries. Japan and emerging markets score very poorly in this regard, indicating most companies do not have many females at a board level. Japan has a low female labour participation rate that has historically been less than 50% and this translates to companies at a senior management level. The Nordic nations on average have a female labour force participation rate in excess of 60%. The US interestingly also has a rather low score, where 51% of companies exhibit more than 30% female board representation.